Arc Forumnew | comments | leaders | submitlogin
Call graph for news.arc [pdf] [scribd] (files.wordpress.com)
8 points by chris_l 5562 days ago | 9 comments


5 points by chris_l 5561 days ago | link

For a more readable version, here I have only plotted what comes below a single newsop (news): http://electronreactor.files.wordpress.com/2009/02/news2.png

-----

2 points by jonnytran 5560 days ago | link

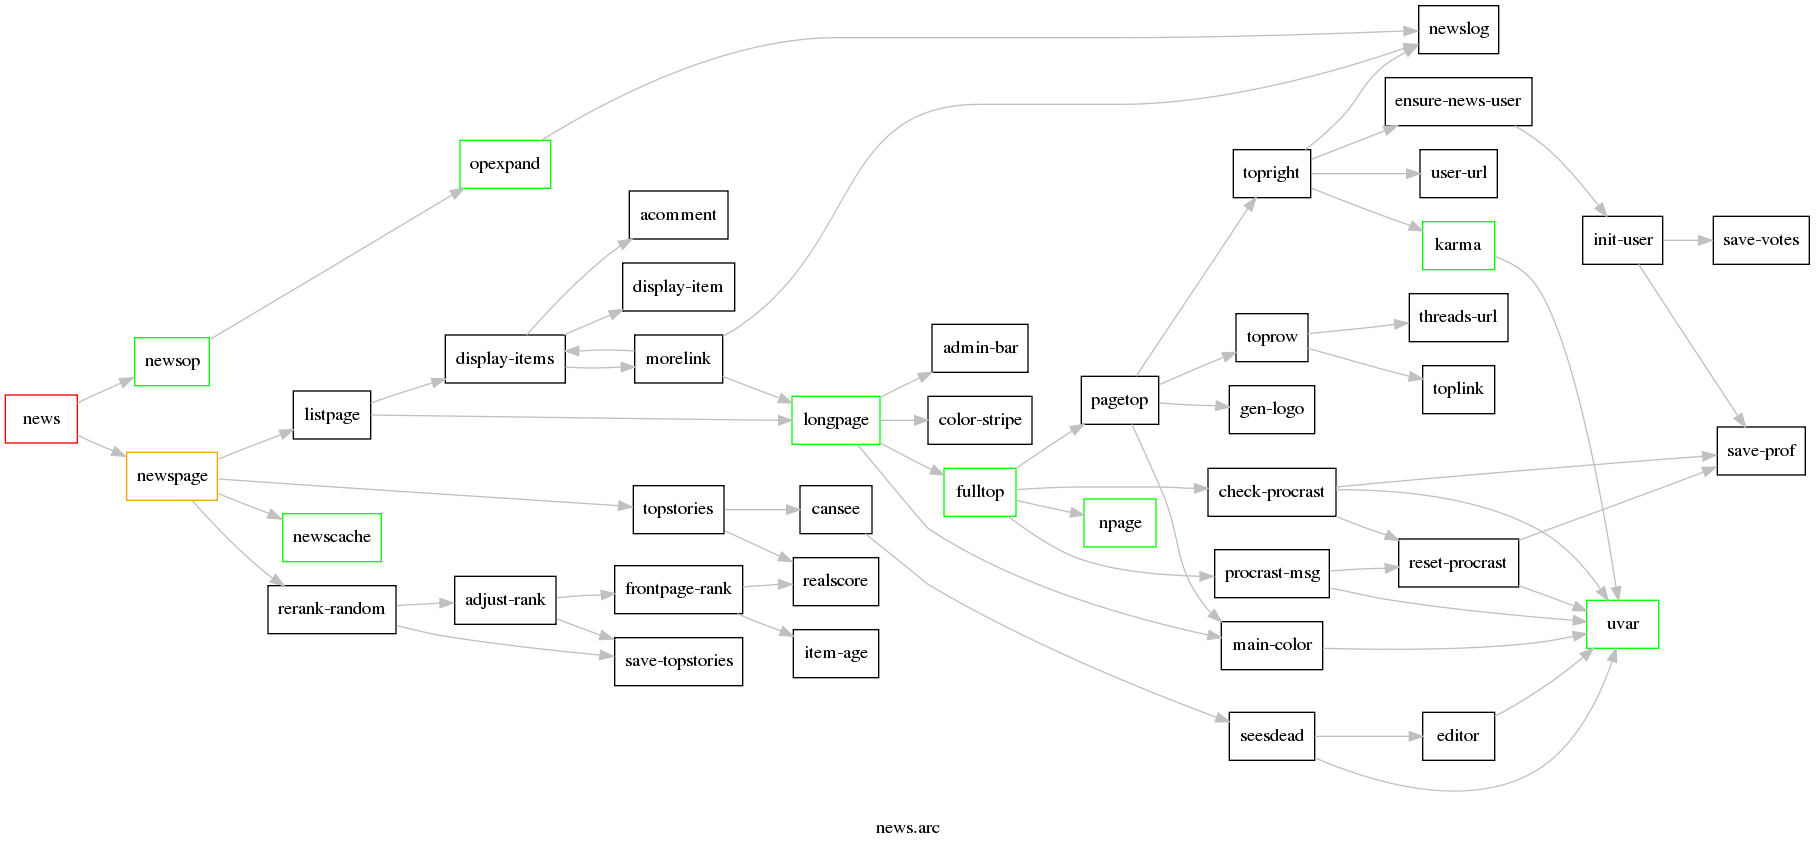
Thank you for making this reduced graph. I'm all for visualization, but the full call graph seemed to show nothing except how useless a full call graph is.

-----

1 point by chris_l 5559 days ago | link

Yeah, that dawned on me after posting it... :)

-----

3 points by chris_l 5555 days ago | link

I've now expanded my work to graphing at the s-expression level of an Arc function. Post: http://electronreactor.wordpress.com/2009/02/11/graphing-arb... Graph: http://electronreactor.files.wordpress.com/2009/02/controlda...

-----

1 point by chris_l 5562 days ago | link

Accompanying post: http://electronreactor.wordpress.com/2009/02/04/call-graph-n...

-----

3 points by CatDancer 5562 days ago | link

The correct URL appears to be http://electronreactor.wordpress.com/2009/02/04/call-graph-n...

-----

2 points by CatDancer 5562 days ago | link

Very cool!

-----

2 points by conanite 5561 days ago | link

I second that.

If you're planning to add dynamic information and looking for ideas, encoding profiling data in the graph could be über cool.

Anarki has a basic profiler - see http://arclanguage.org/item?id=5318

-----

1 point by chris_l 5561 days ago | link

Thanks for the hint, I've now got a simple version where it takes the who-called-who from recording invocations. I'm currently working on sample call data, but profiling would also be interesting.

-----